What 10% below "max pain" means for Bitcoin

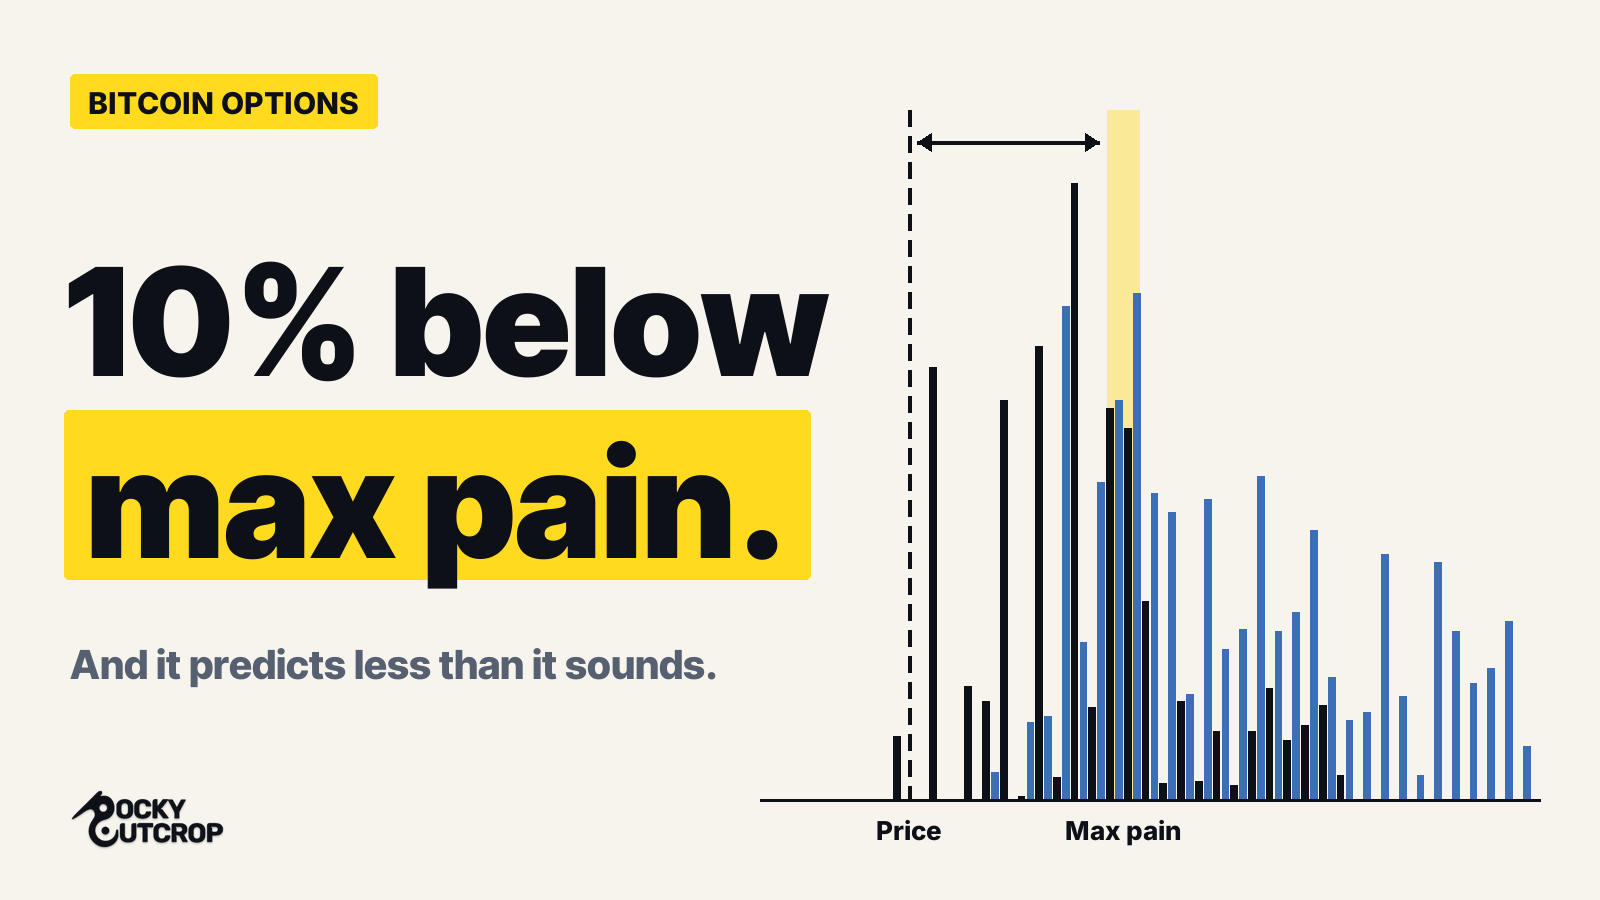
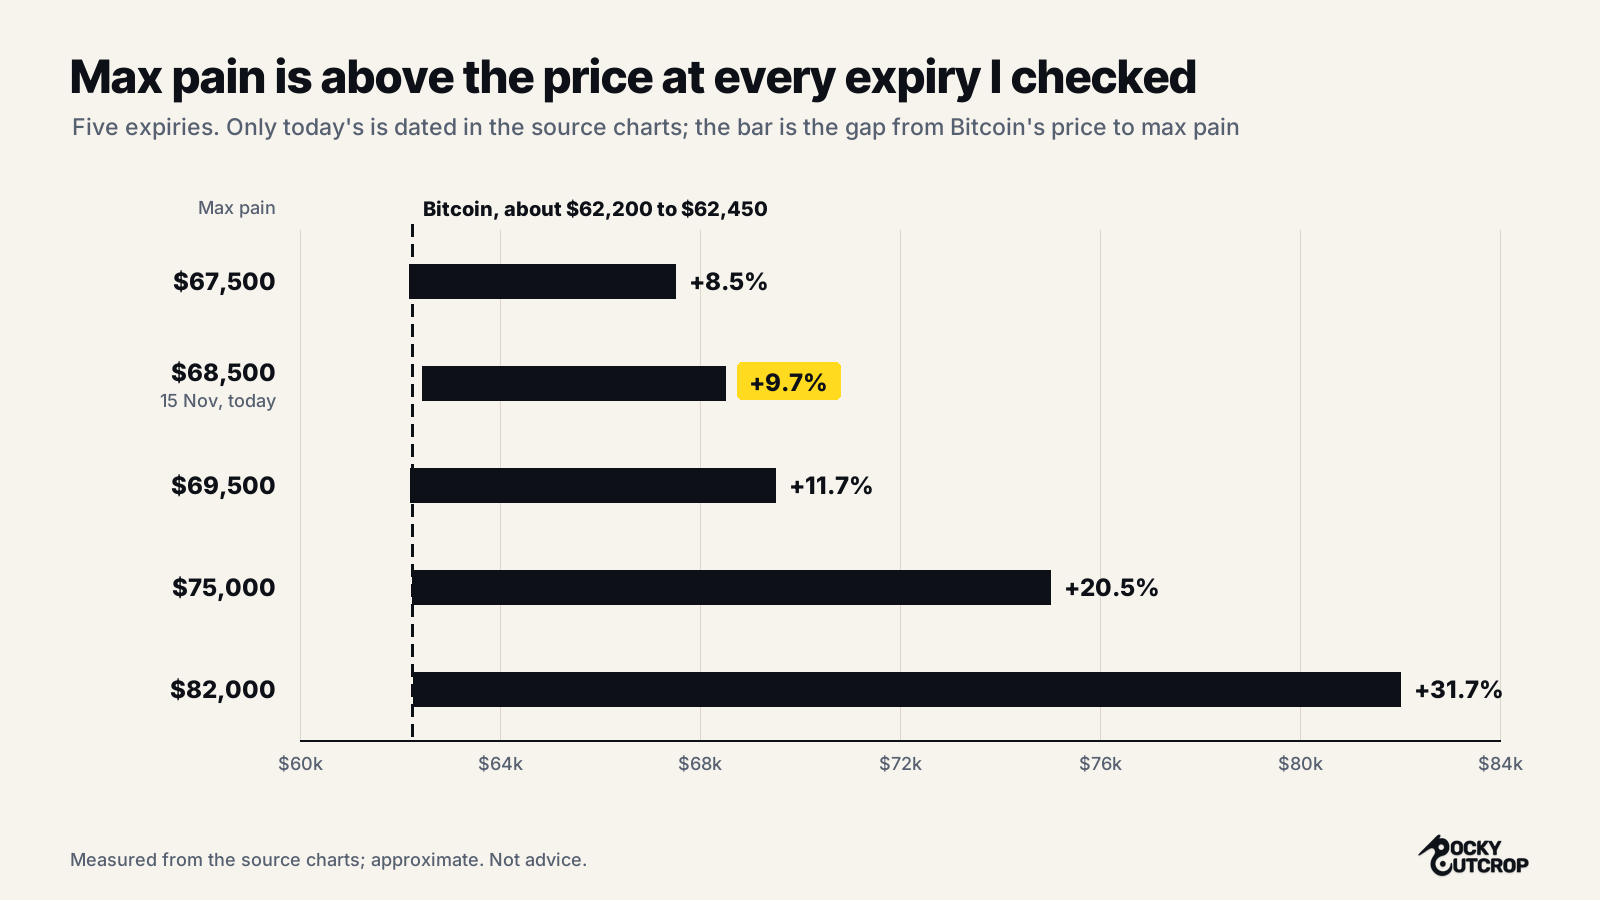
Bitcoin is trading near $62,450. The options market's "max pain" price for today's expiry is $68,500, nearly 10% higher. You will see that gap quoted as a reason the price should rise. It isn't one. Here is what the number means, and what the options market is really showing.
What expires today
An option is a contract with an end date. A call pays out if Bitcoin finishes above a chosen price, called the strike. A put pays out if it finishes below. Today 5,277 BTC of options expire, worth about $330 million.
What max pain is
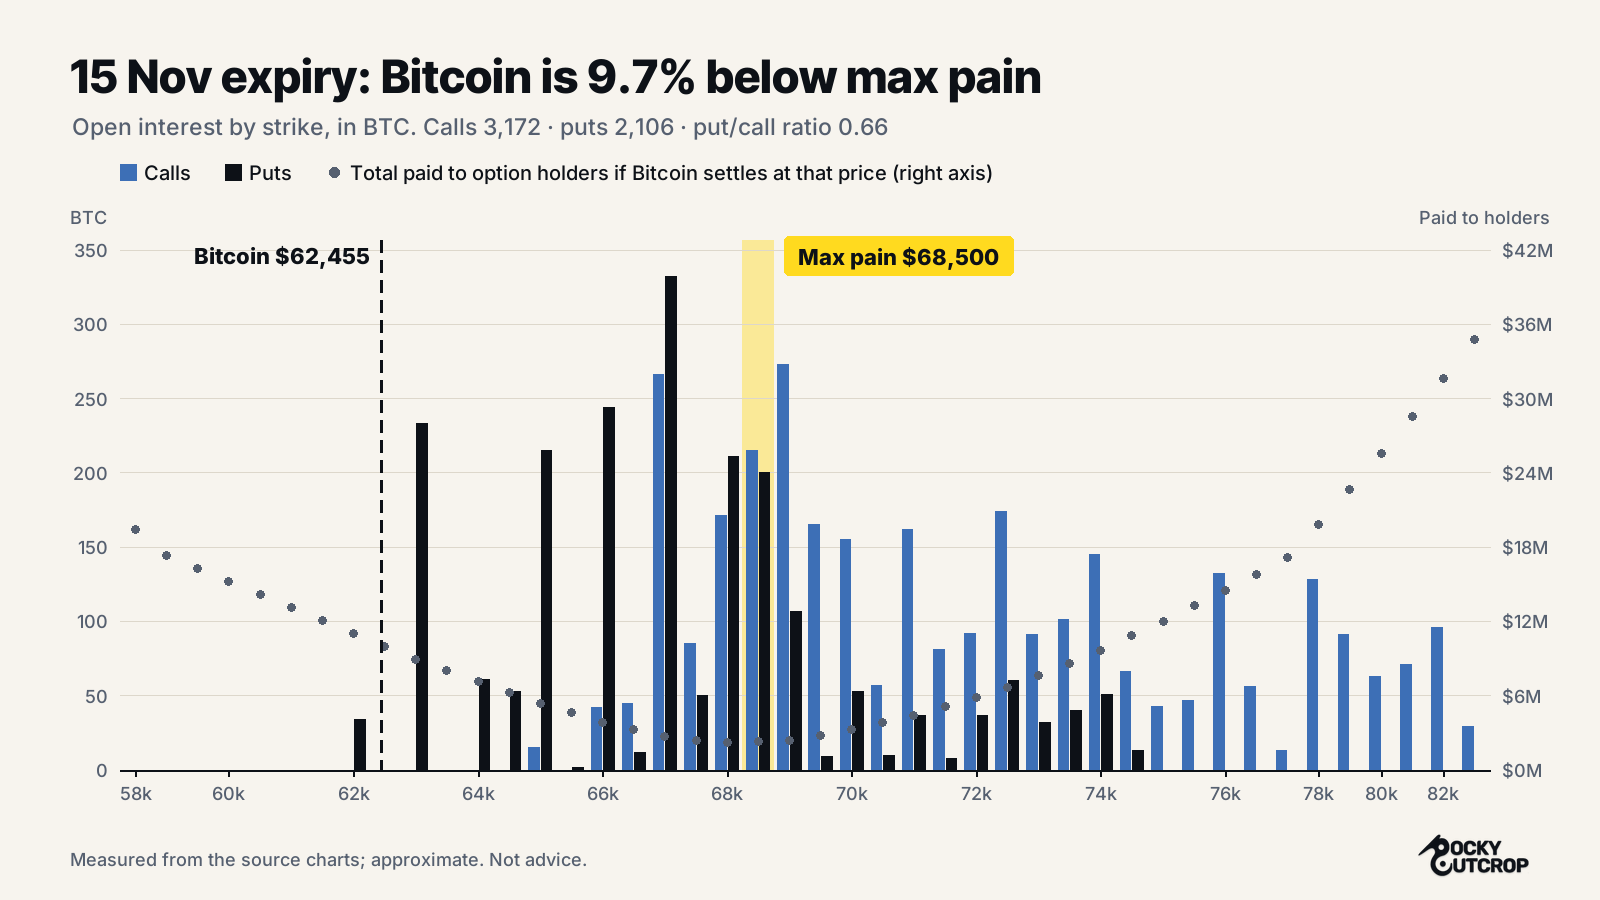
Take every option expiring on one date. Work out what holders would be paid in total at each possible finishing price. Max pain is the price where that total is smallest: holders get the least, and the sellers keep the most.
The grey dots show that total. They bottom out at $68,500, where holders would be paid about $2 million. At today's price they are paid about $10 million.
The theory says price drifts toward max pain because the sellers, mostly market makers, hedge in ways that pull it there. The evidence is mixed. It is weakest when the gap is wide and time is short. Today the gap is 9.7% and the clock has nearly run out.
Who is being paid
Look at the bars. Every call strike sits above the current price, so every call expiring today is worthless as things stand. The puts are the opposite. There are large positions at $63,000, $65,000, $66,000 and $67,000, and all of them are in the money. The people being paid today are the ones who bought protection against a fall.
The put/call ratio
Divide puts by calls. Today that is 2,106 BTC of puts against 3,172 of calls: 0.66. Across every expiry it is roughly 156,000 against 211,000, about 0.74. A ratio under 1 means more calls than puts, and it usually gets read as bullish.
I don't think that reading holds here, for two reasons.
First, the count doesn't say who bought and who sold. Plenty of calls are sold for income, not bought as a bet on a rise.
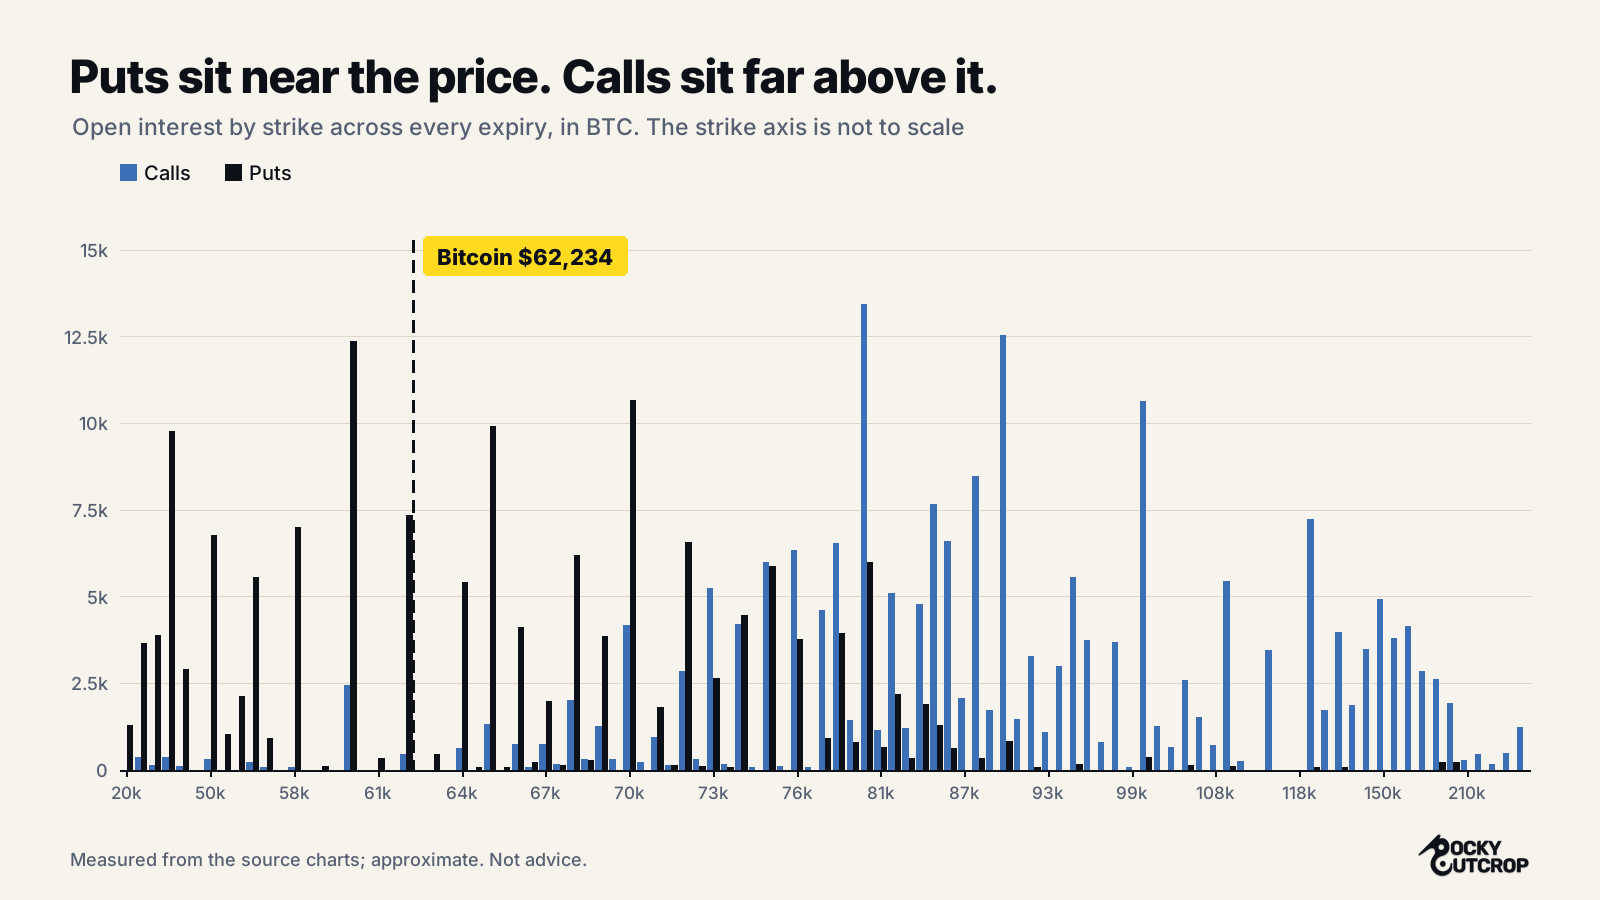
Second, look where the positions sit. The puts cluster around today's price, where they matter. The calls are stacked from $70,000 up past $100,000, a long way from here, and many were likely opened when Bitcoin was higher. A ratio of 0.66, with the puts paying and the calls not, looks like a market that bought protection and has been right.
Where the weight is
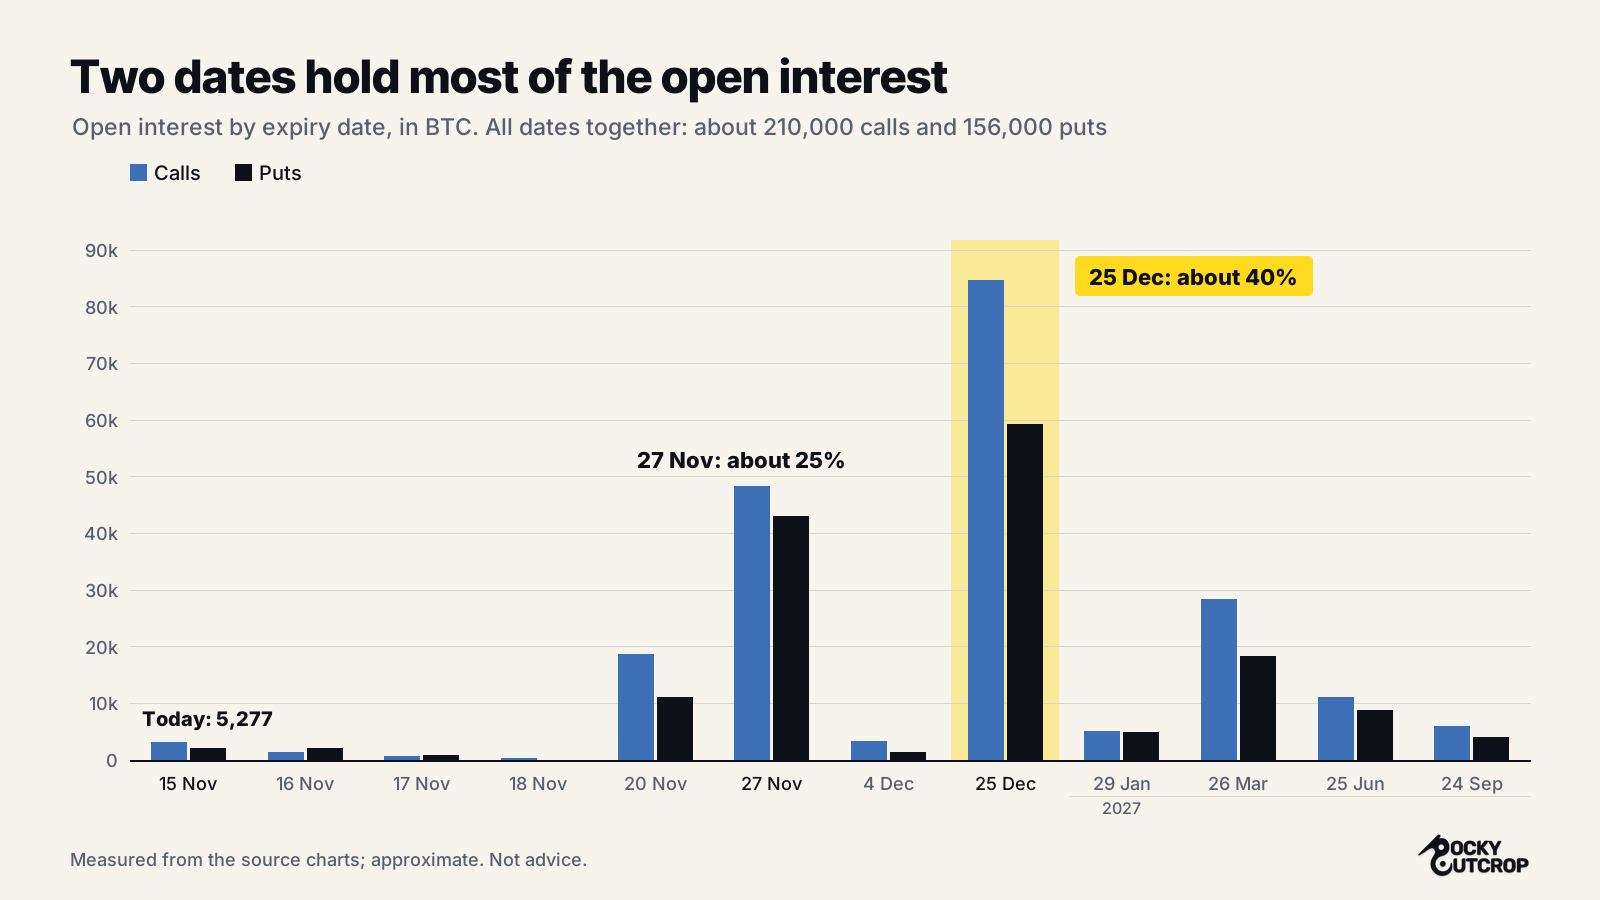
Today's expiry is small. Two dates hold most of the open interest: 27 Nov with about a quarter and 25 Dec with about 40%. Positioning on those dates matters far more than today's.
What it means for Bitcoin
- Max pain is not a forecast. At 9.7% away with hours left, its pull can be close to nothing.
- Max pain is above the price at every expiry I checked, by 8% to 32%. That mostly records where options were opened when prices were higher. It does not mean the market expects those levels.
- The puts near the price cut both ways. If market makers sold them, they hedge by selling Bitcoin as it falls toward those strikes, which can speed a drop. This data can't show who holds what, so it is a risk to watch, not a signal.
The claim that should be made here, which you can check against the settlement price today: the key level is $65,075 - if that breaks and holds for 8 hours of the day then bitcoin has a chance of making it back to the Max Pain price, and possibly putting in a relief rally to close some of the major gap that will appear on the CME charts now (BTC1!). But without a V-shaped recovery the expiry settles more than 5% below max pain, under $65,075. Which makes this a race between the options chain and the futures market, if you want me to break down CME gaps let me know in comments/replies.
The source for my market data for BTC/USD Max Pain came from Coinbase and you can read more about Coinbase's insights here coinbase.com/market-stats - to see market data like Max Pain its best to log into your account and go to coinbase.com/advanced-markets. I made my own images in this post.